> ## Documentation Index
> Fetch the complete documentation index at: https://docs.glowstudio.ai/llms.txt
> Use this file to discover all available pages before exploring further.
# Analytics
The Analytics tab provides a powerful suite of tools to monitor and analyze your AI agent's performance. Whether you're fine-tuning your agent or reporting to clients, these insights will help you make data-driven decisions to enhance user experience and engagement.
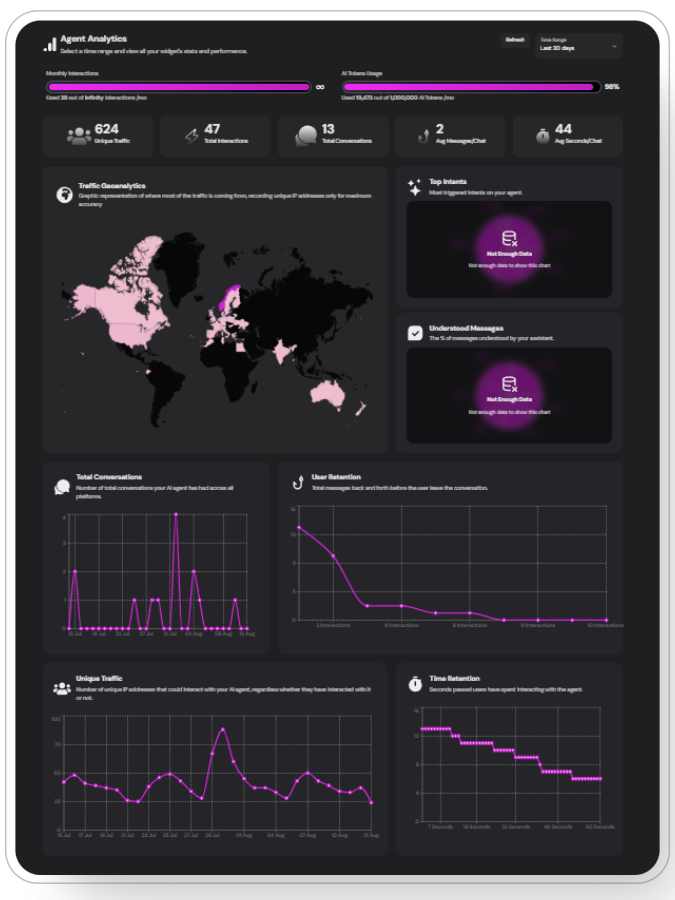 Access the Analytics tab for each agent to view detailed performance metrics and user interaction data.
## Key Metrics at a Glance
Track the number of interactions your agent handles based on time filtering.
Access the Analytics tab for each agent to view detailed performance metrics and user interaction data.
## Key Metrics at a Glance
Track the number of interactions your agent handles based on time filtering.
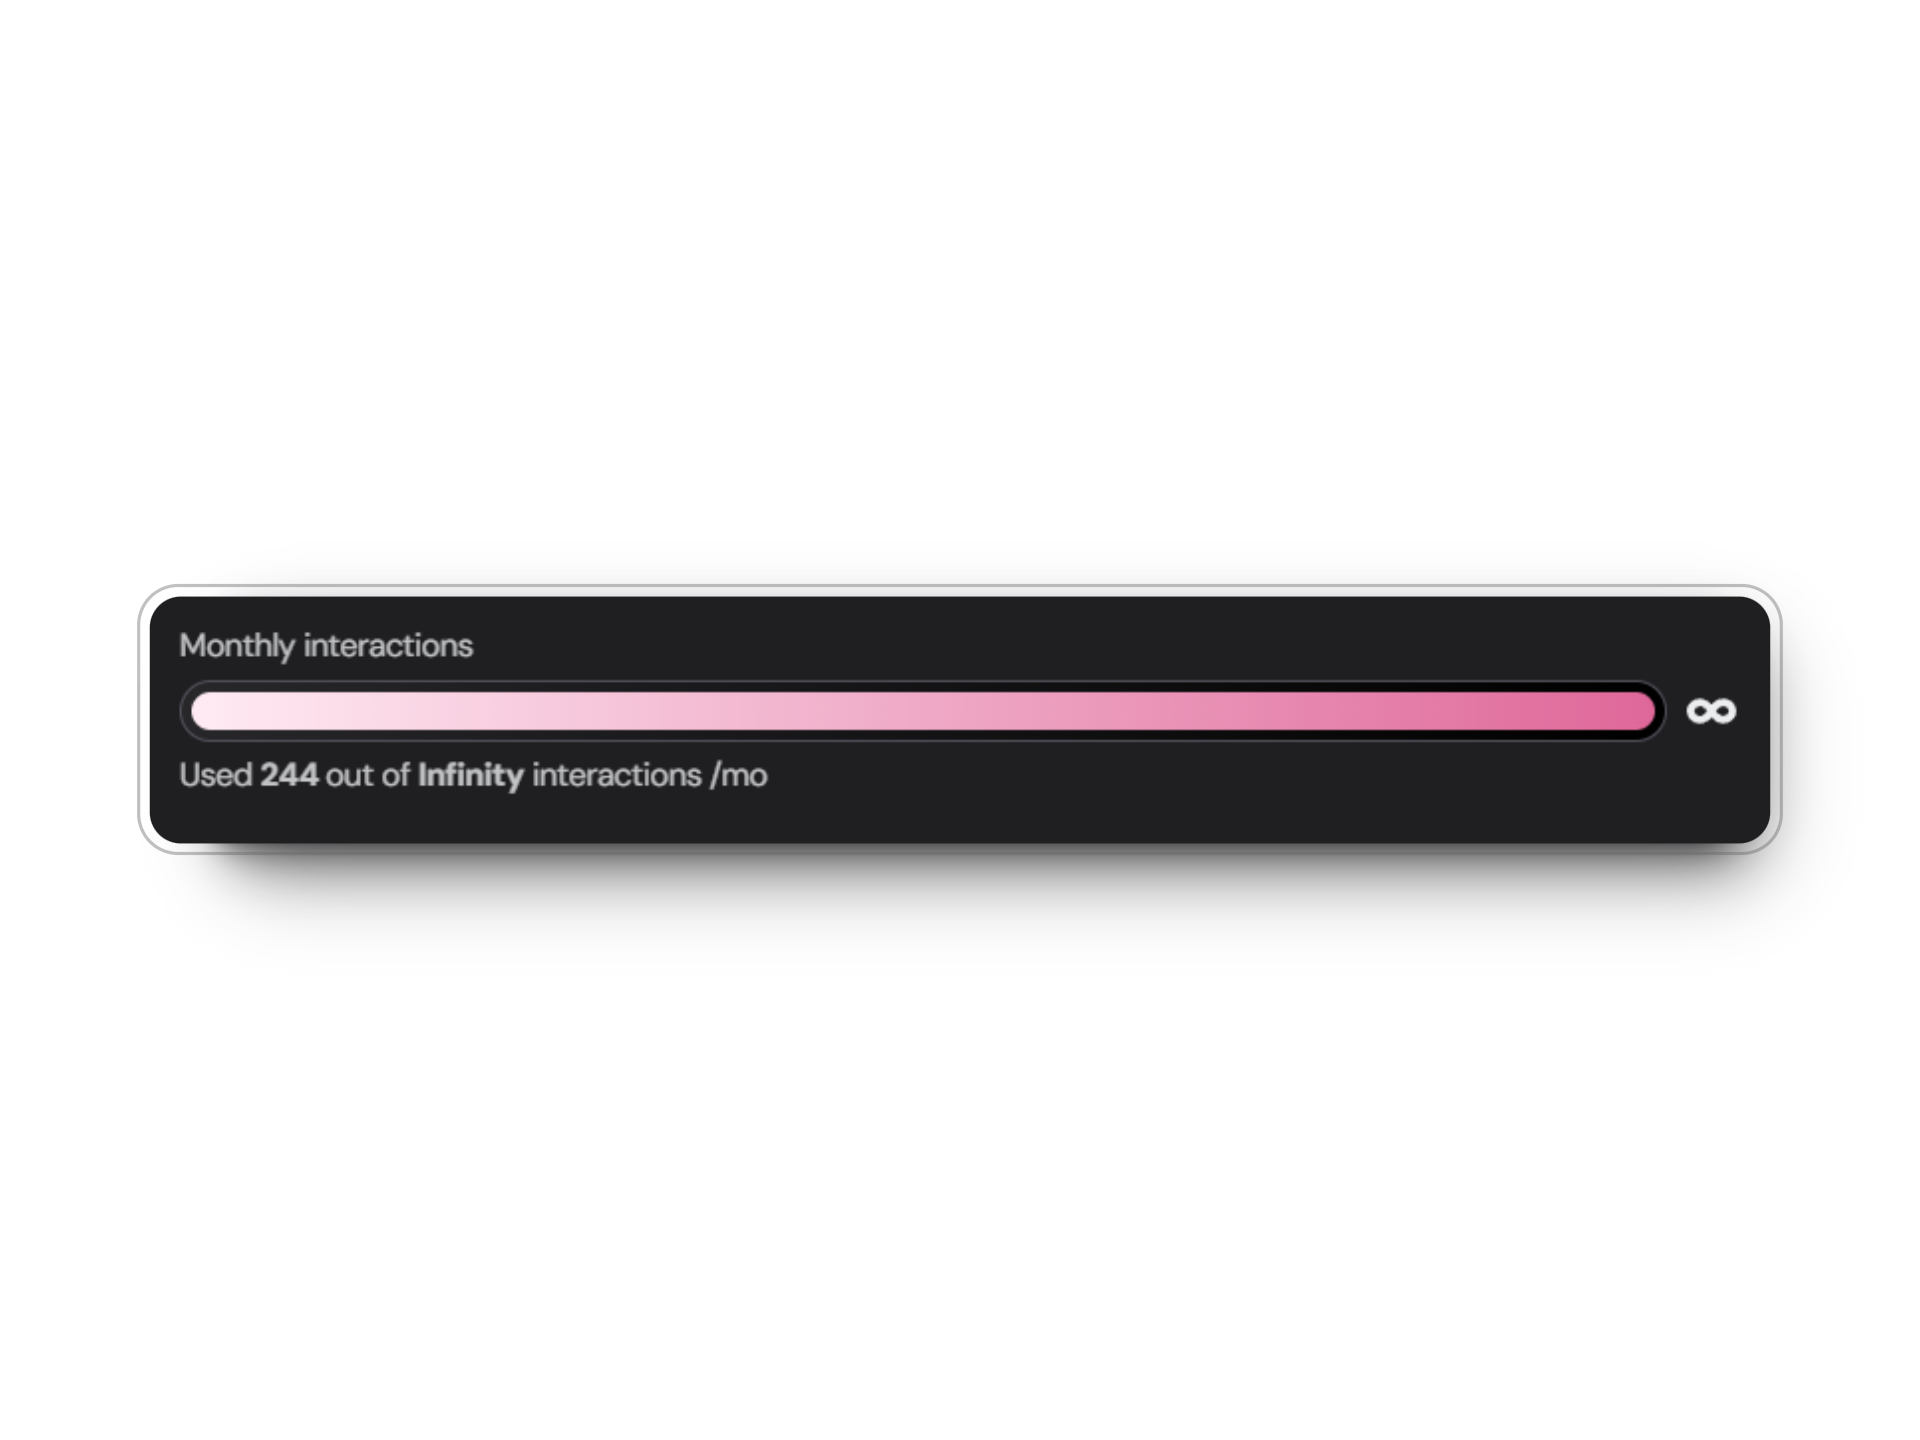 Custom limit can be set in the agent settings tab
Monitor the consumption of AI tokens to optimize costs and performance.
Custom limit can be set in the agent settings tab
Monitor the consumption of AI tokens to optimize costs and performance.
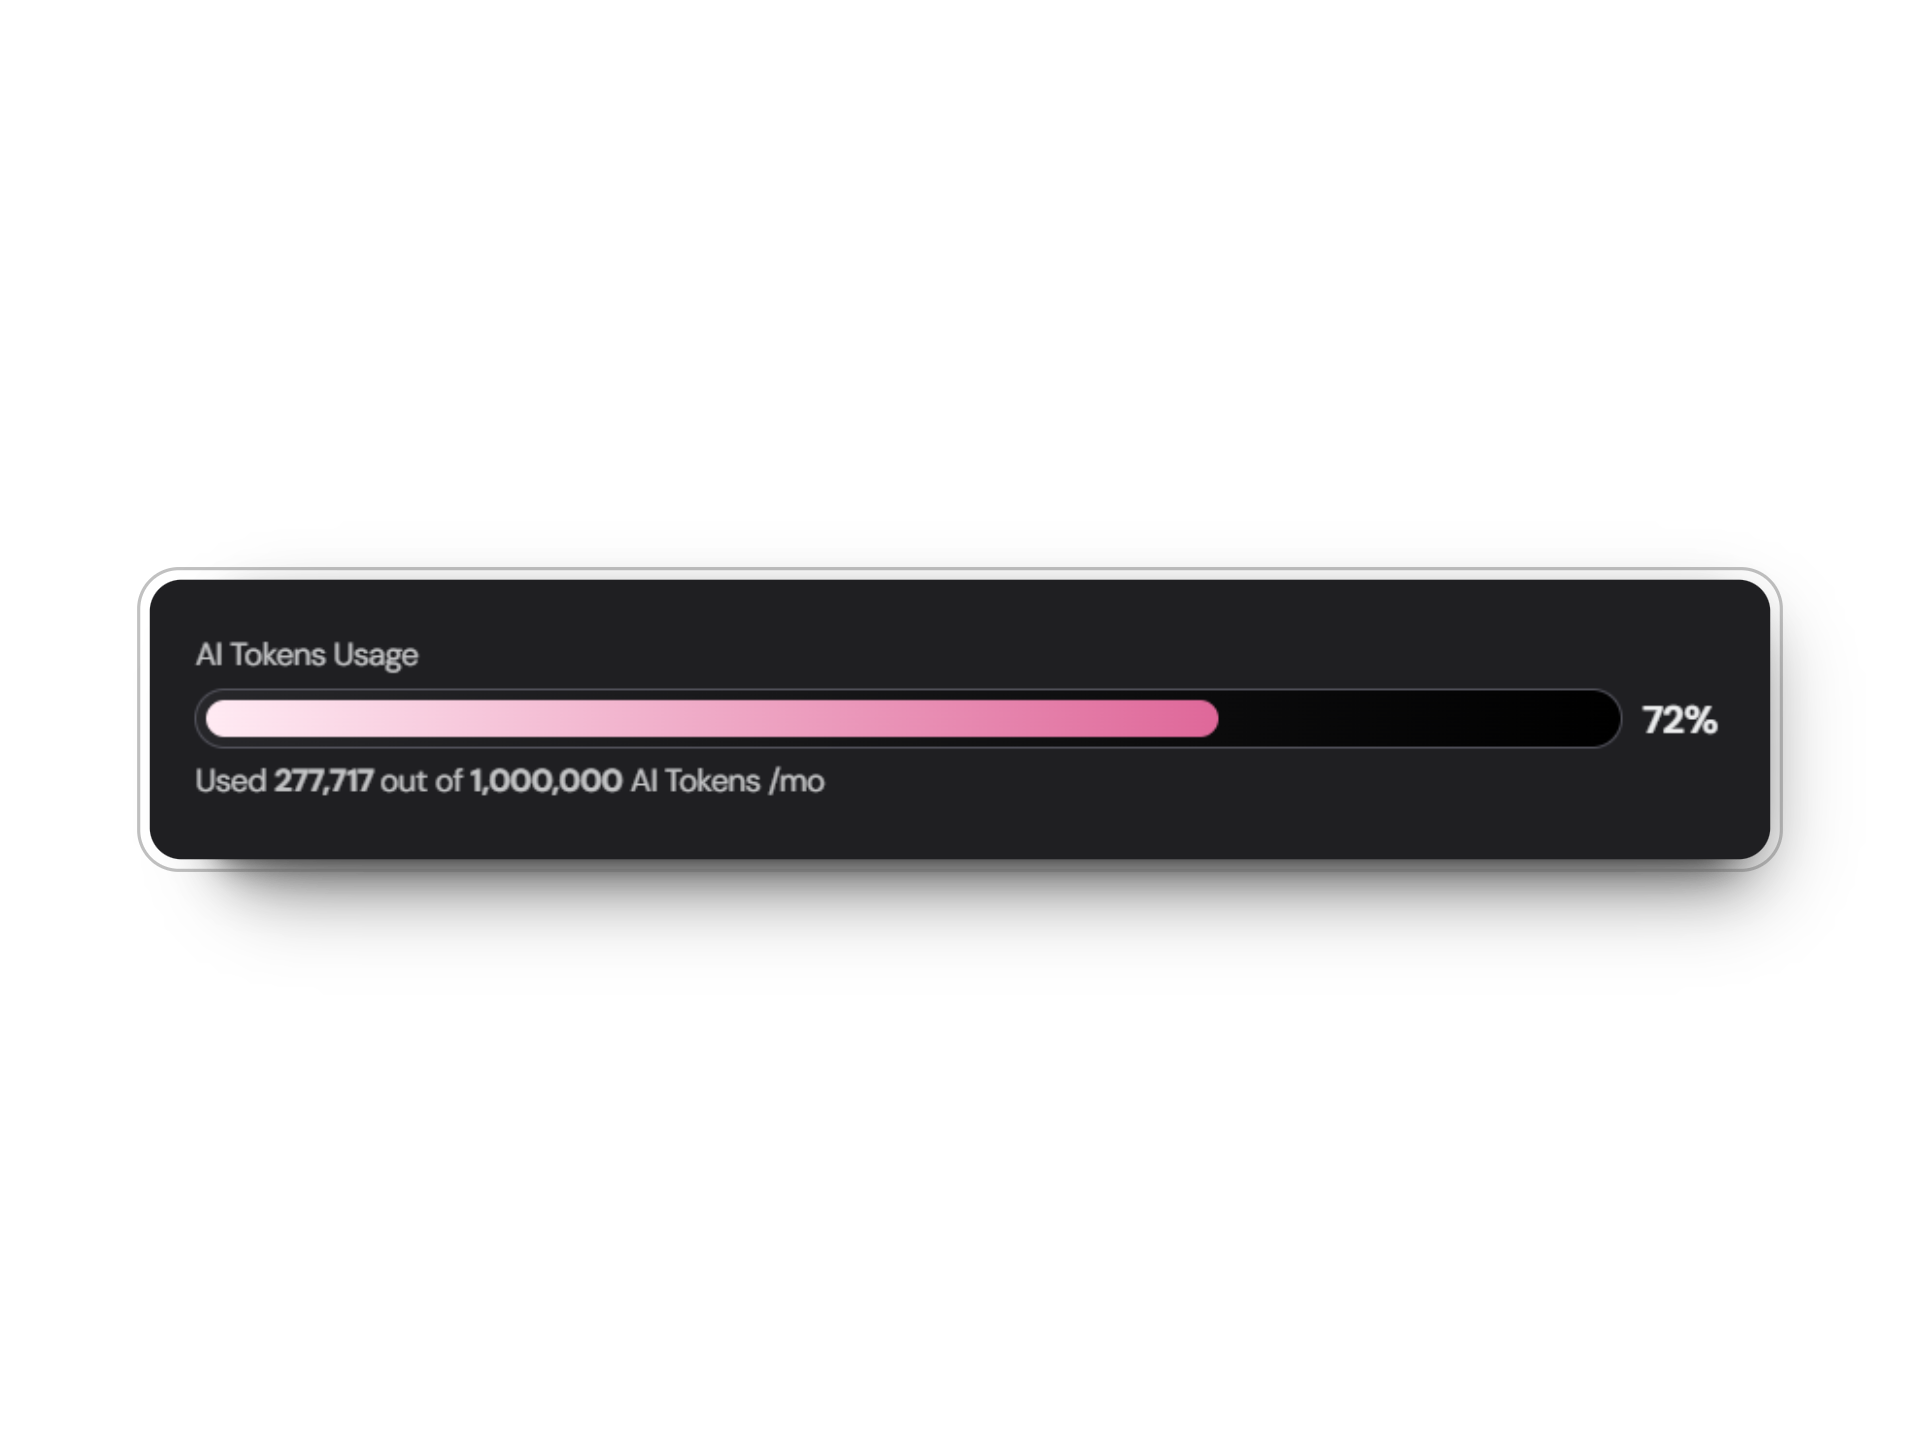 Custom limit can be set in the agent settings tab
View the cumulative number of interactions over time.
Keep track of the number of distinct conversations initiated with your agent.
Understand the average length and depth of conversations with your agent.
Measure the efficiency of your agent by tracking the average duration of interactions.
The **total interactions** and **total conversations** are displayed as key metrics at the top of the Analytics tab and as graphs based on your selected time range.
## Detailed Performance Metrics
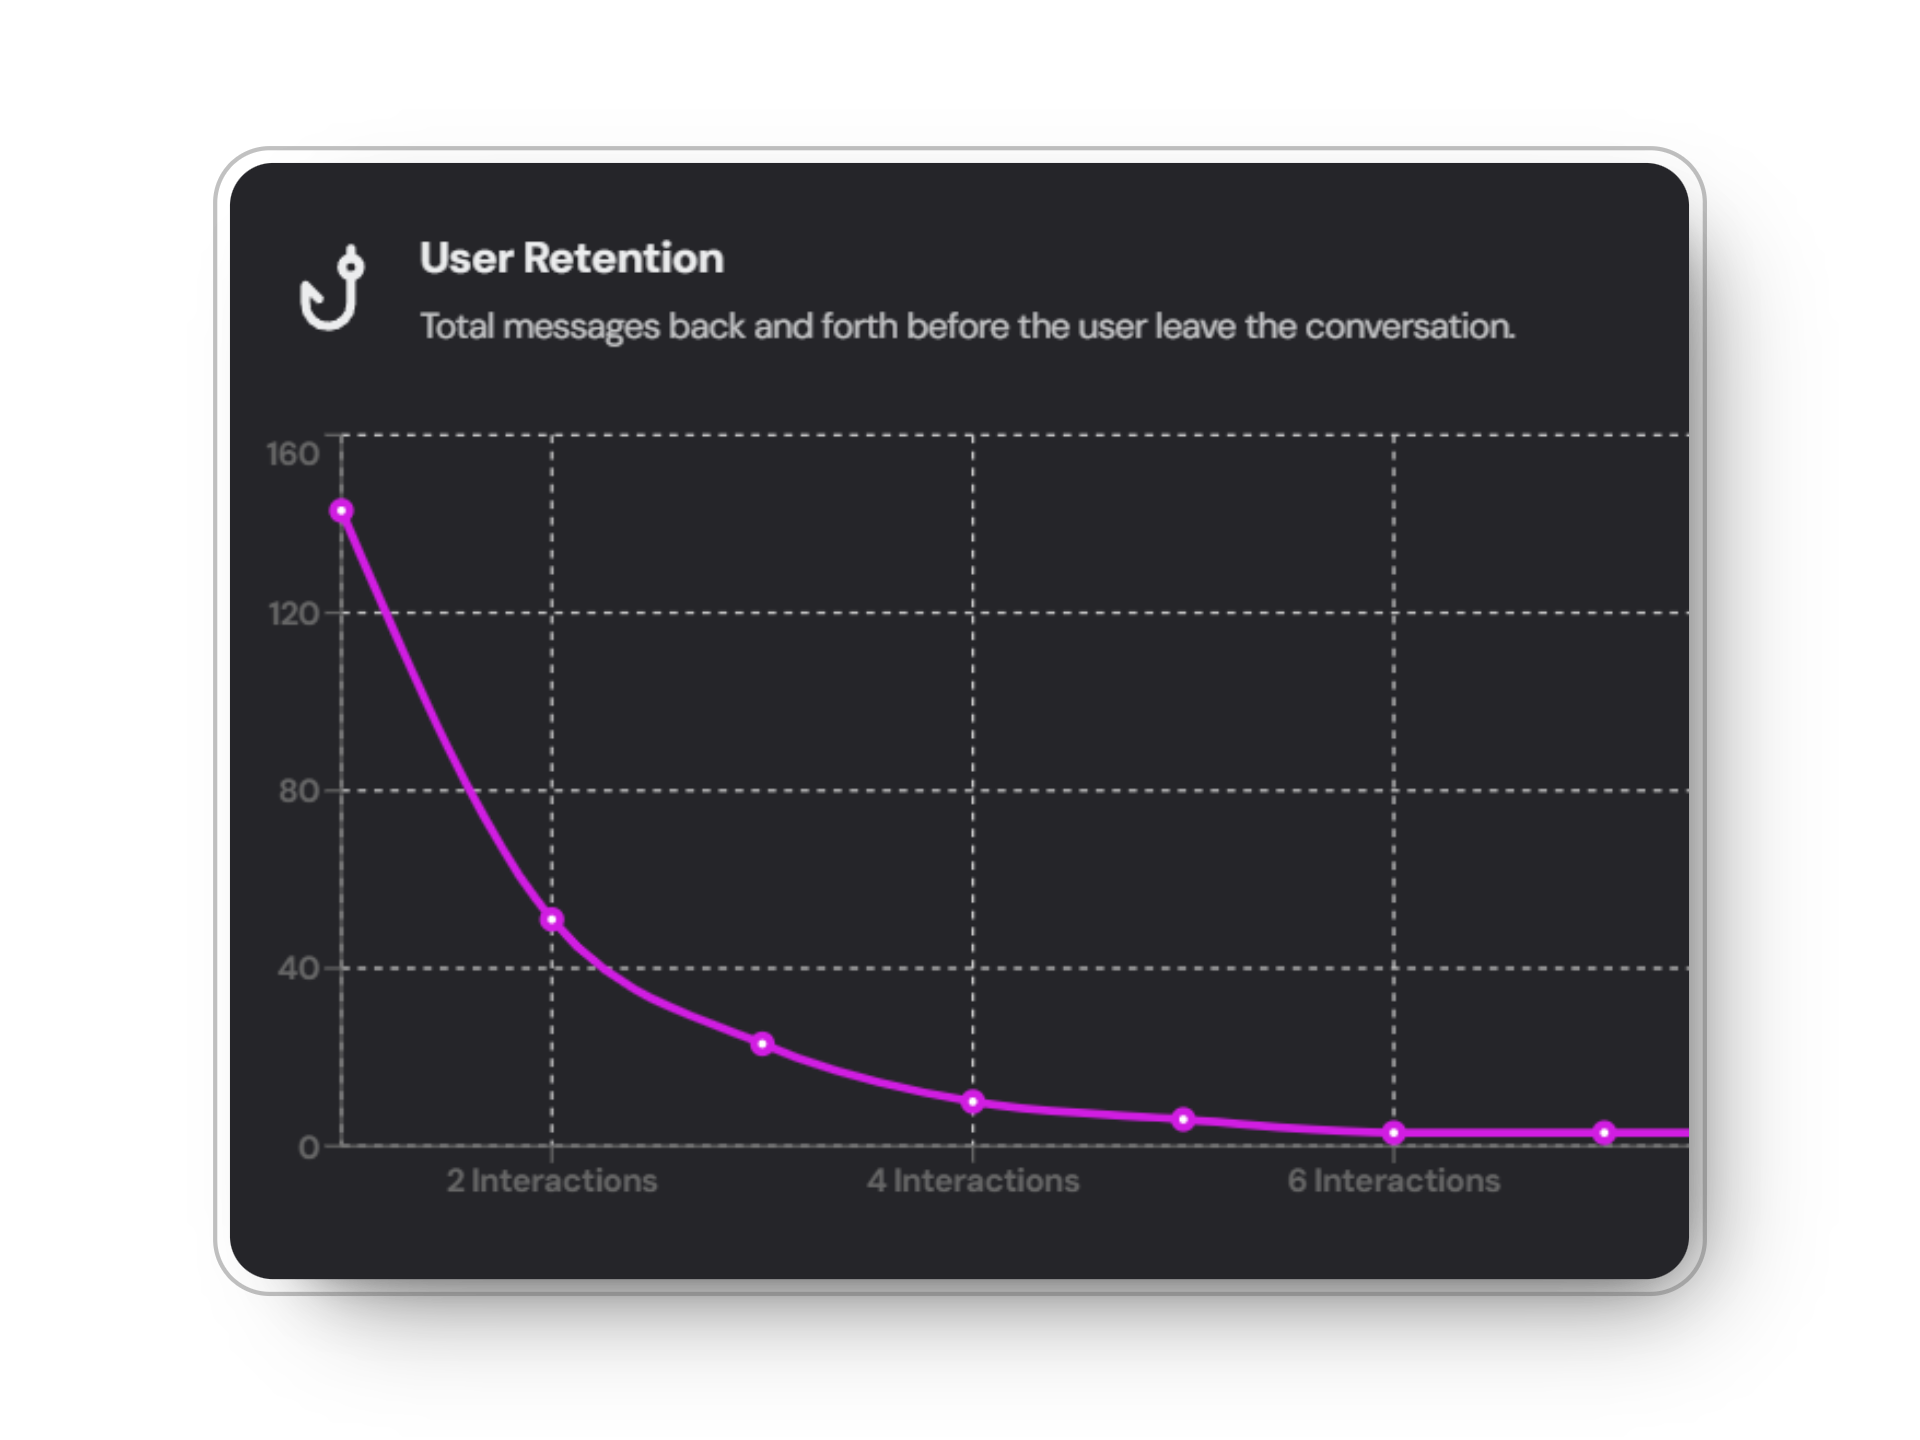
Visualize user engagement with a graph showing the total messages exchanged before users leave the conversation. Measured by date and amount of interactions.
Custom limit can be set in the agent settings tab
View the cumulative number of interactions over time.
Keep track of the number of distinct conversations initiated with your agent.
Understand the average length and depth of conversations with your agent.
Measure the efficiency of your agent by tracking the average duration of interactions.
The **total interactions** and **total conversations** are displayed as key metrics at the top of the Analytics tab and as graphs based on your selected time range.
## Detailed Performance Metrics
Visualize user engagement with a graph showing the total messages exchanged before users leave the conversation. Measured by date and amount of interactions.
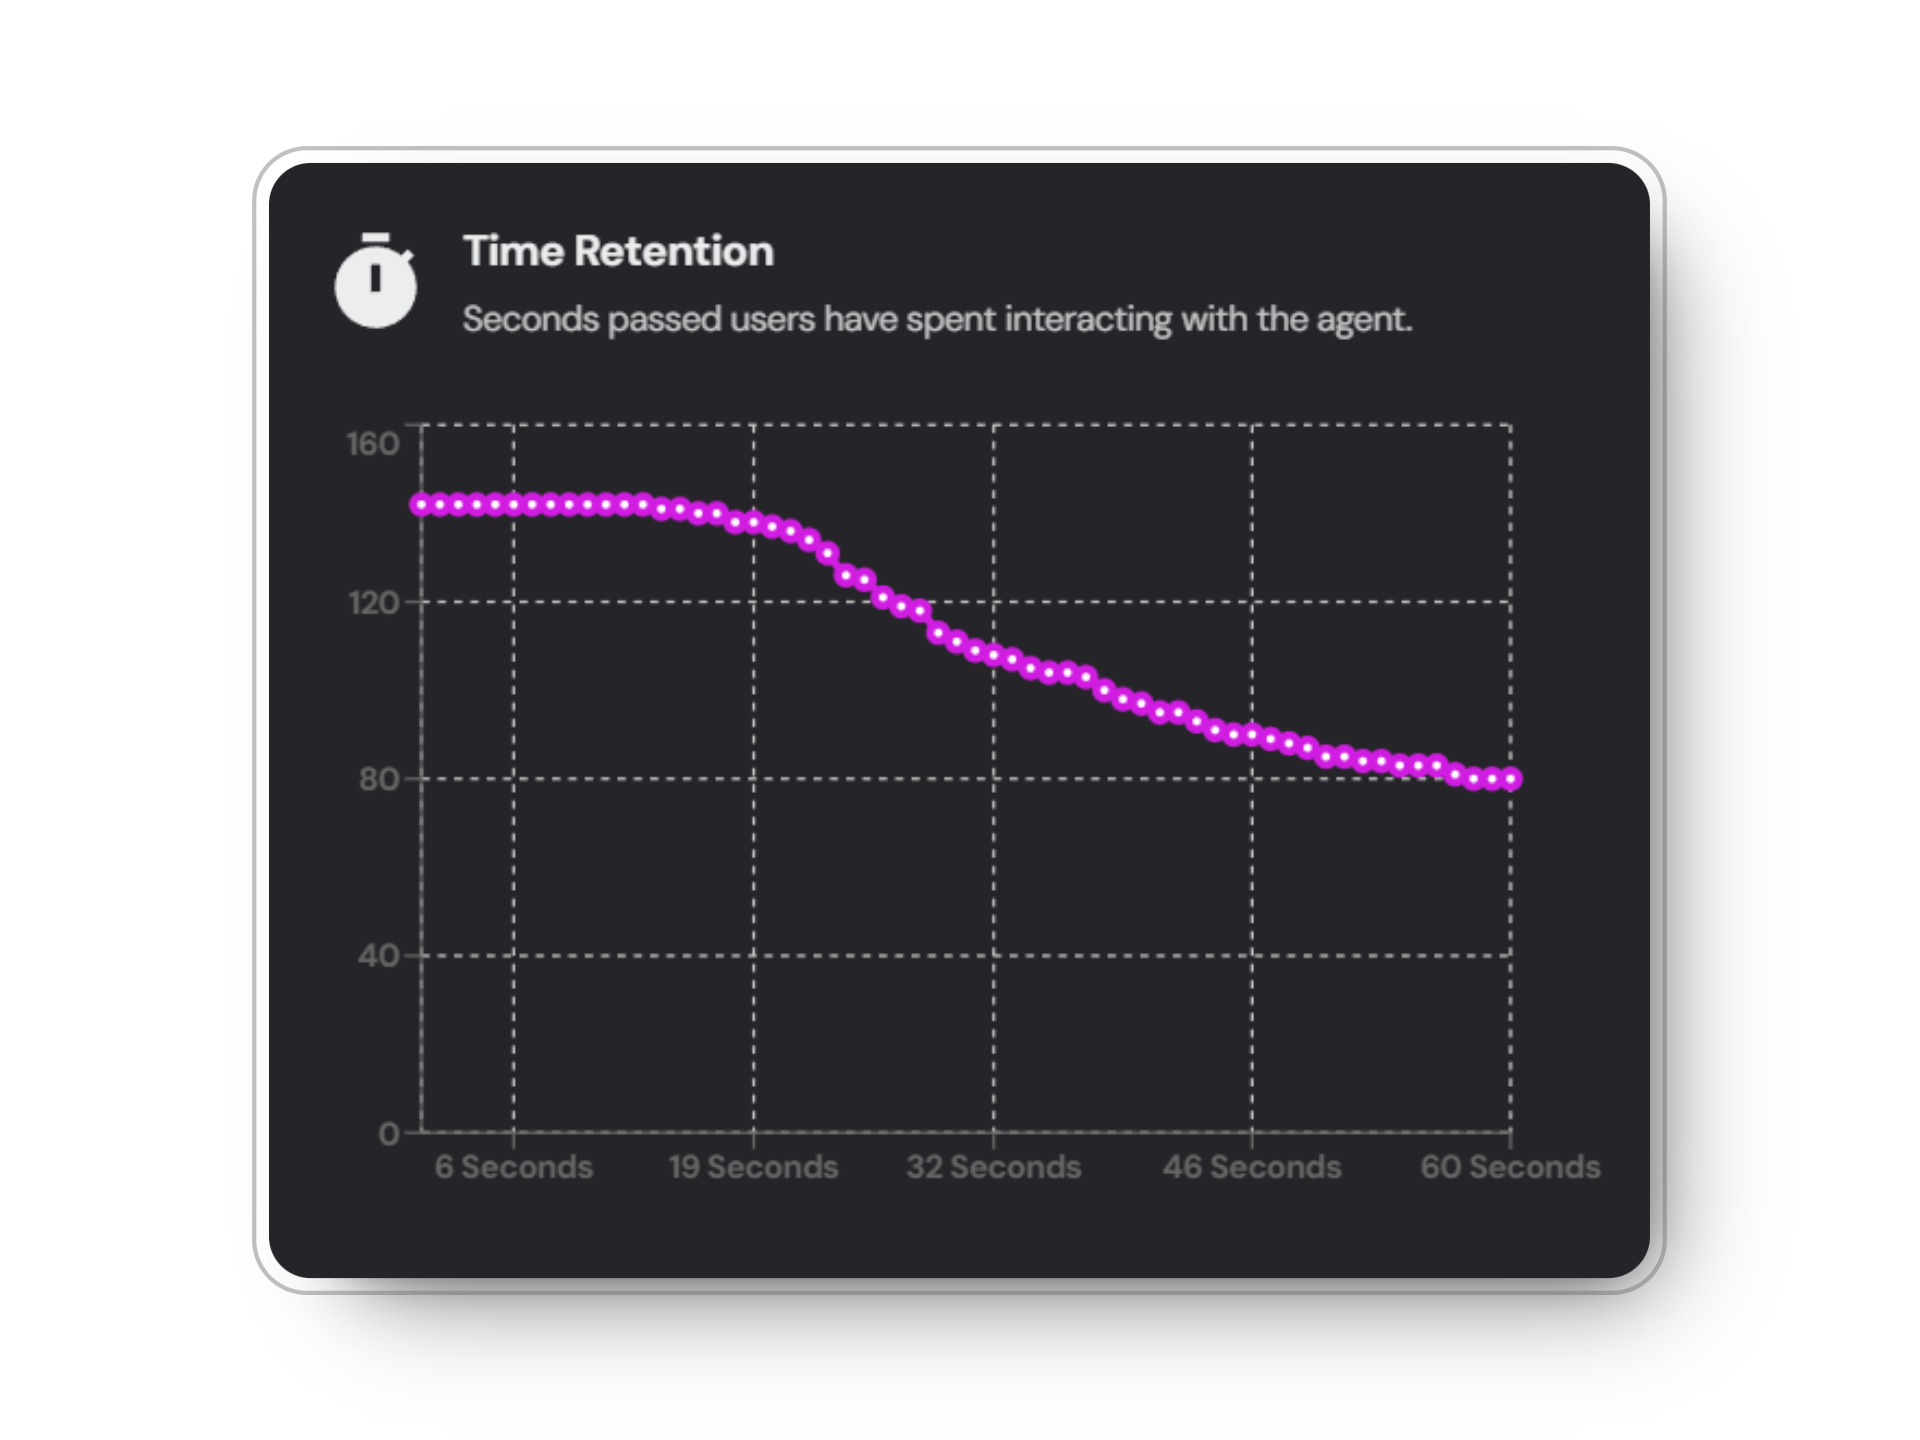
 Analyze user engagement duration with a graph displaying the total seconds users spend interacting with your agent. Measured by amount of users and time spent.
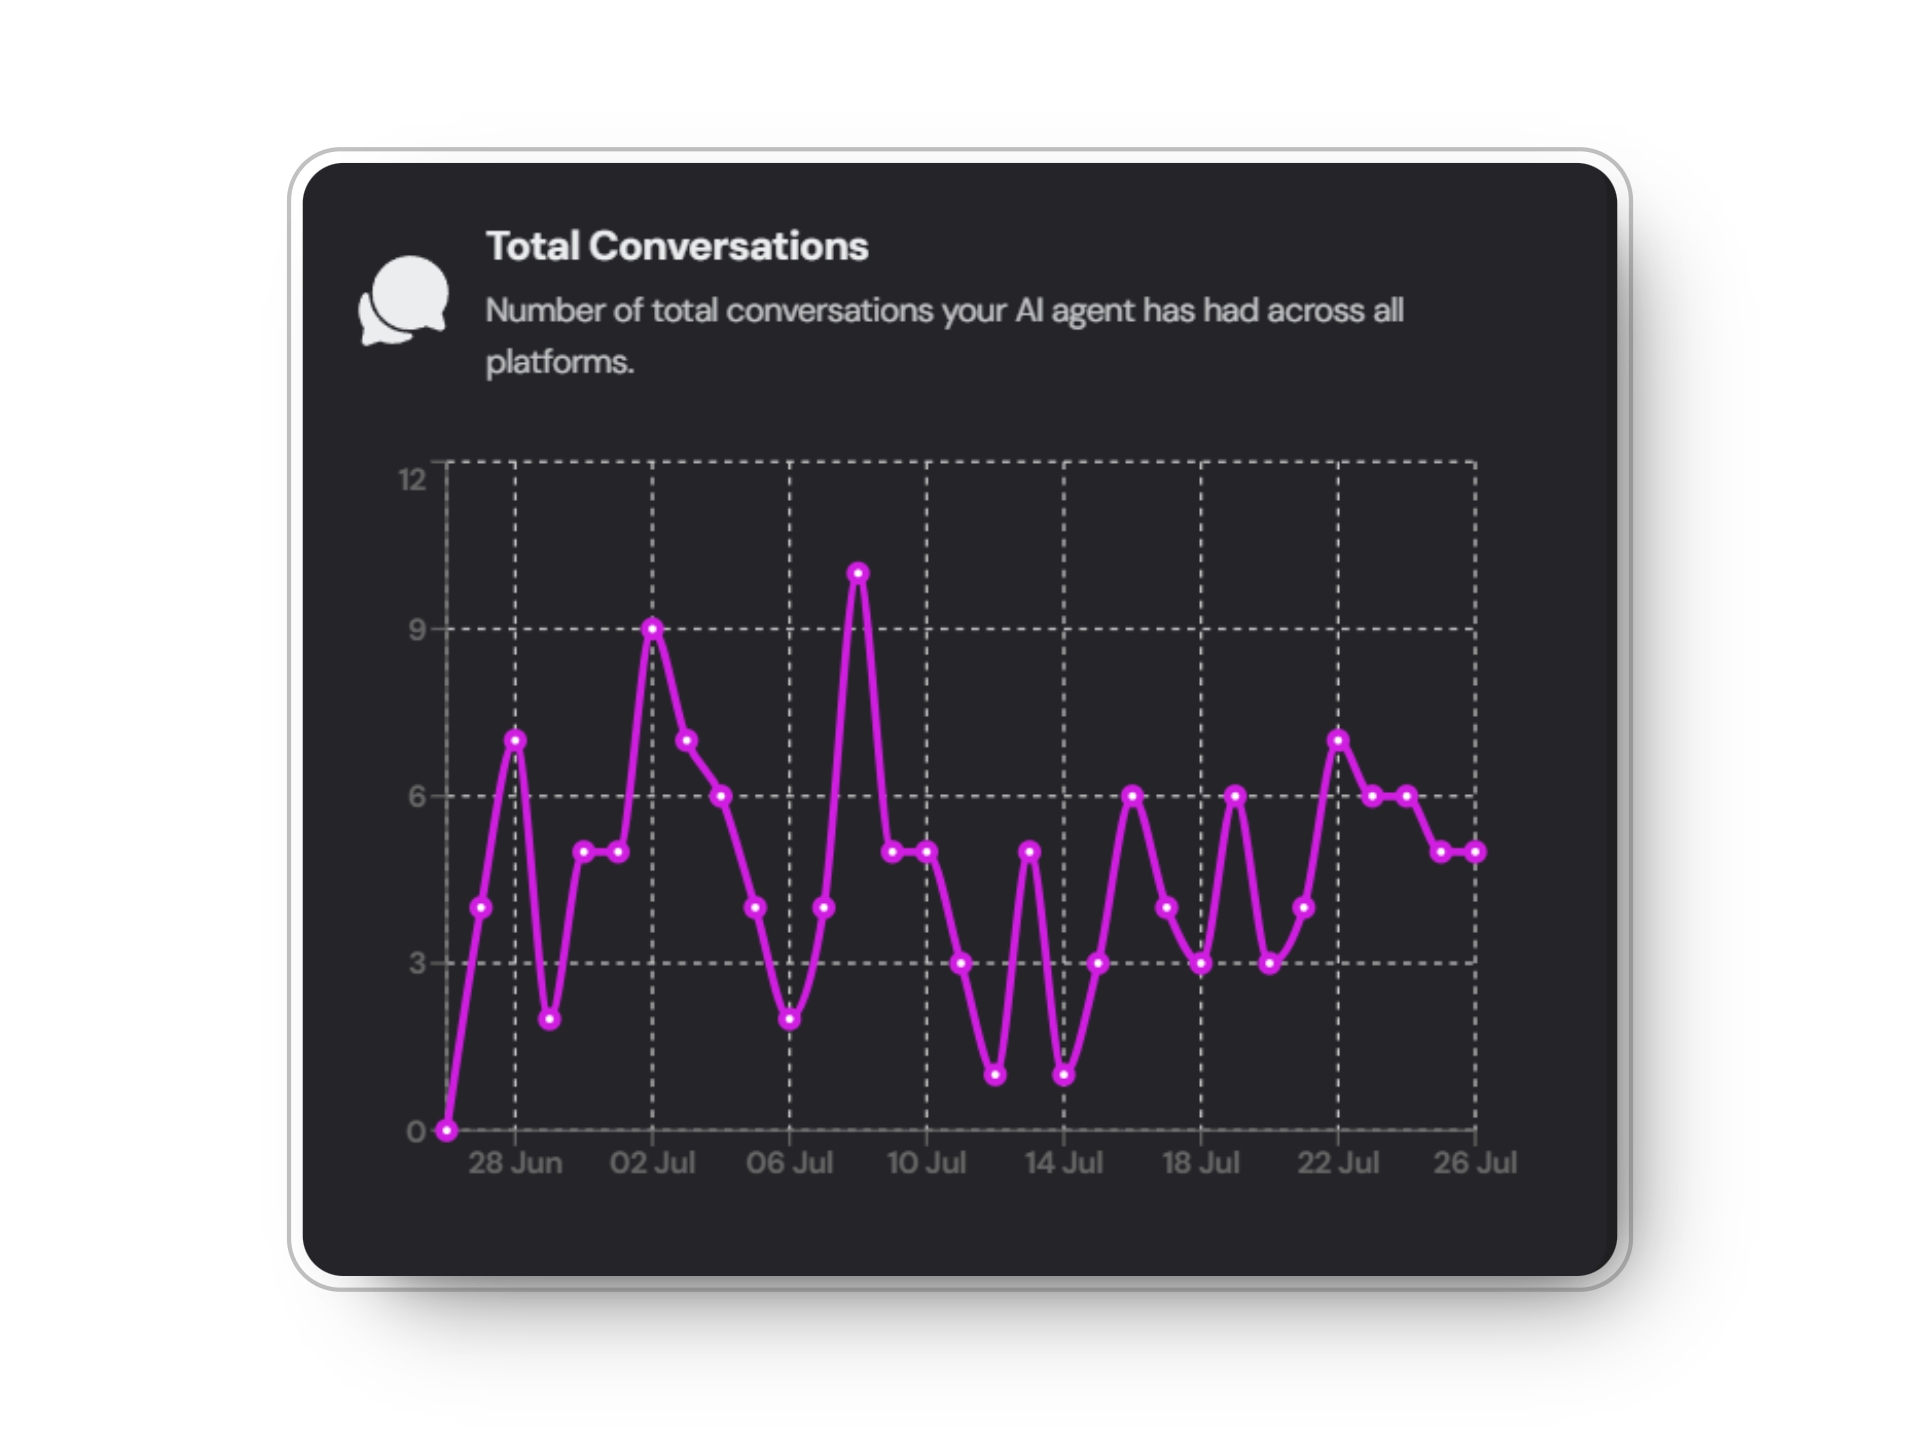
 Analyze user conversations over time with your agent through a graph. Measure by amount of conversations and date based on your chosen time range.
 ## Geographic Insights
Enable GeoAnalytics in the [settings](/agenct-creation/agent-settings) tab of your agent to gain insights into the geographical distribution of your users:
GeoAnalytics is an `optional feature` that provides valuable location-based data about users interacting with your agent.
## Geographic Insights
Enable GeoAnalytics in the [settings](/agenct-creation/agent-settings) tab of your agent to gain insights into the geographical distribution of your users:
GeoAnalytics is an `optional feature` that provides valuable location-based data about users interacting with your agent.
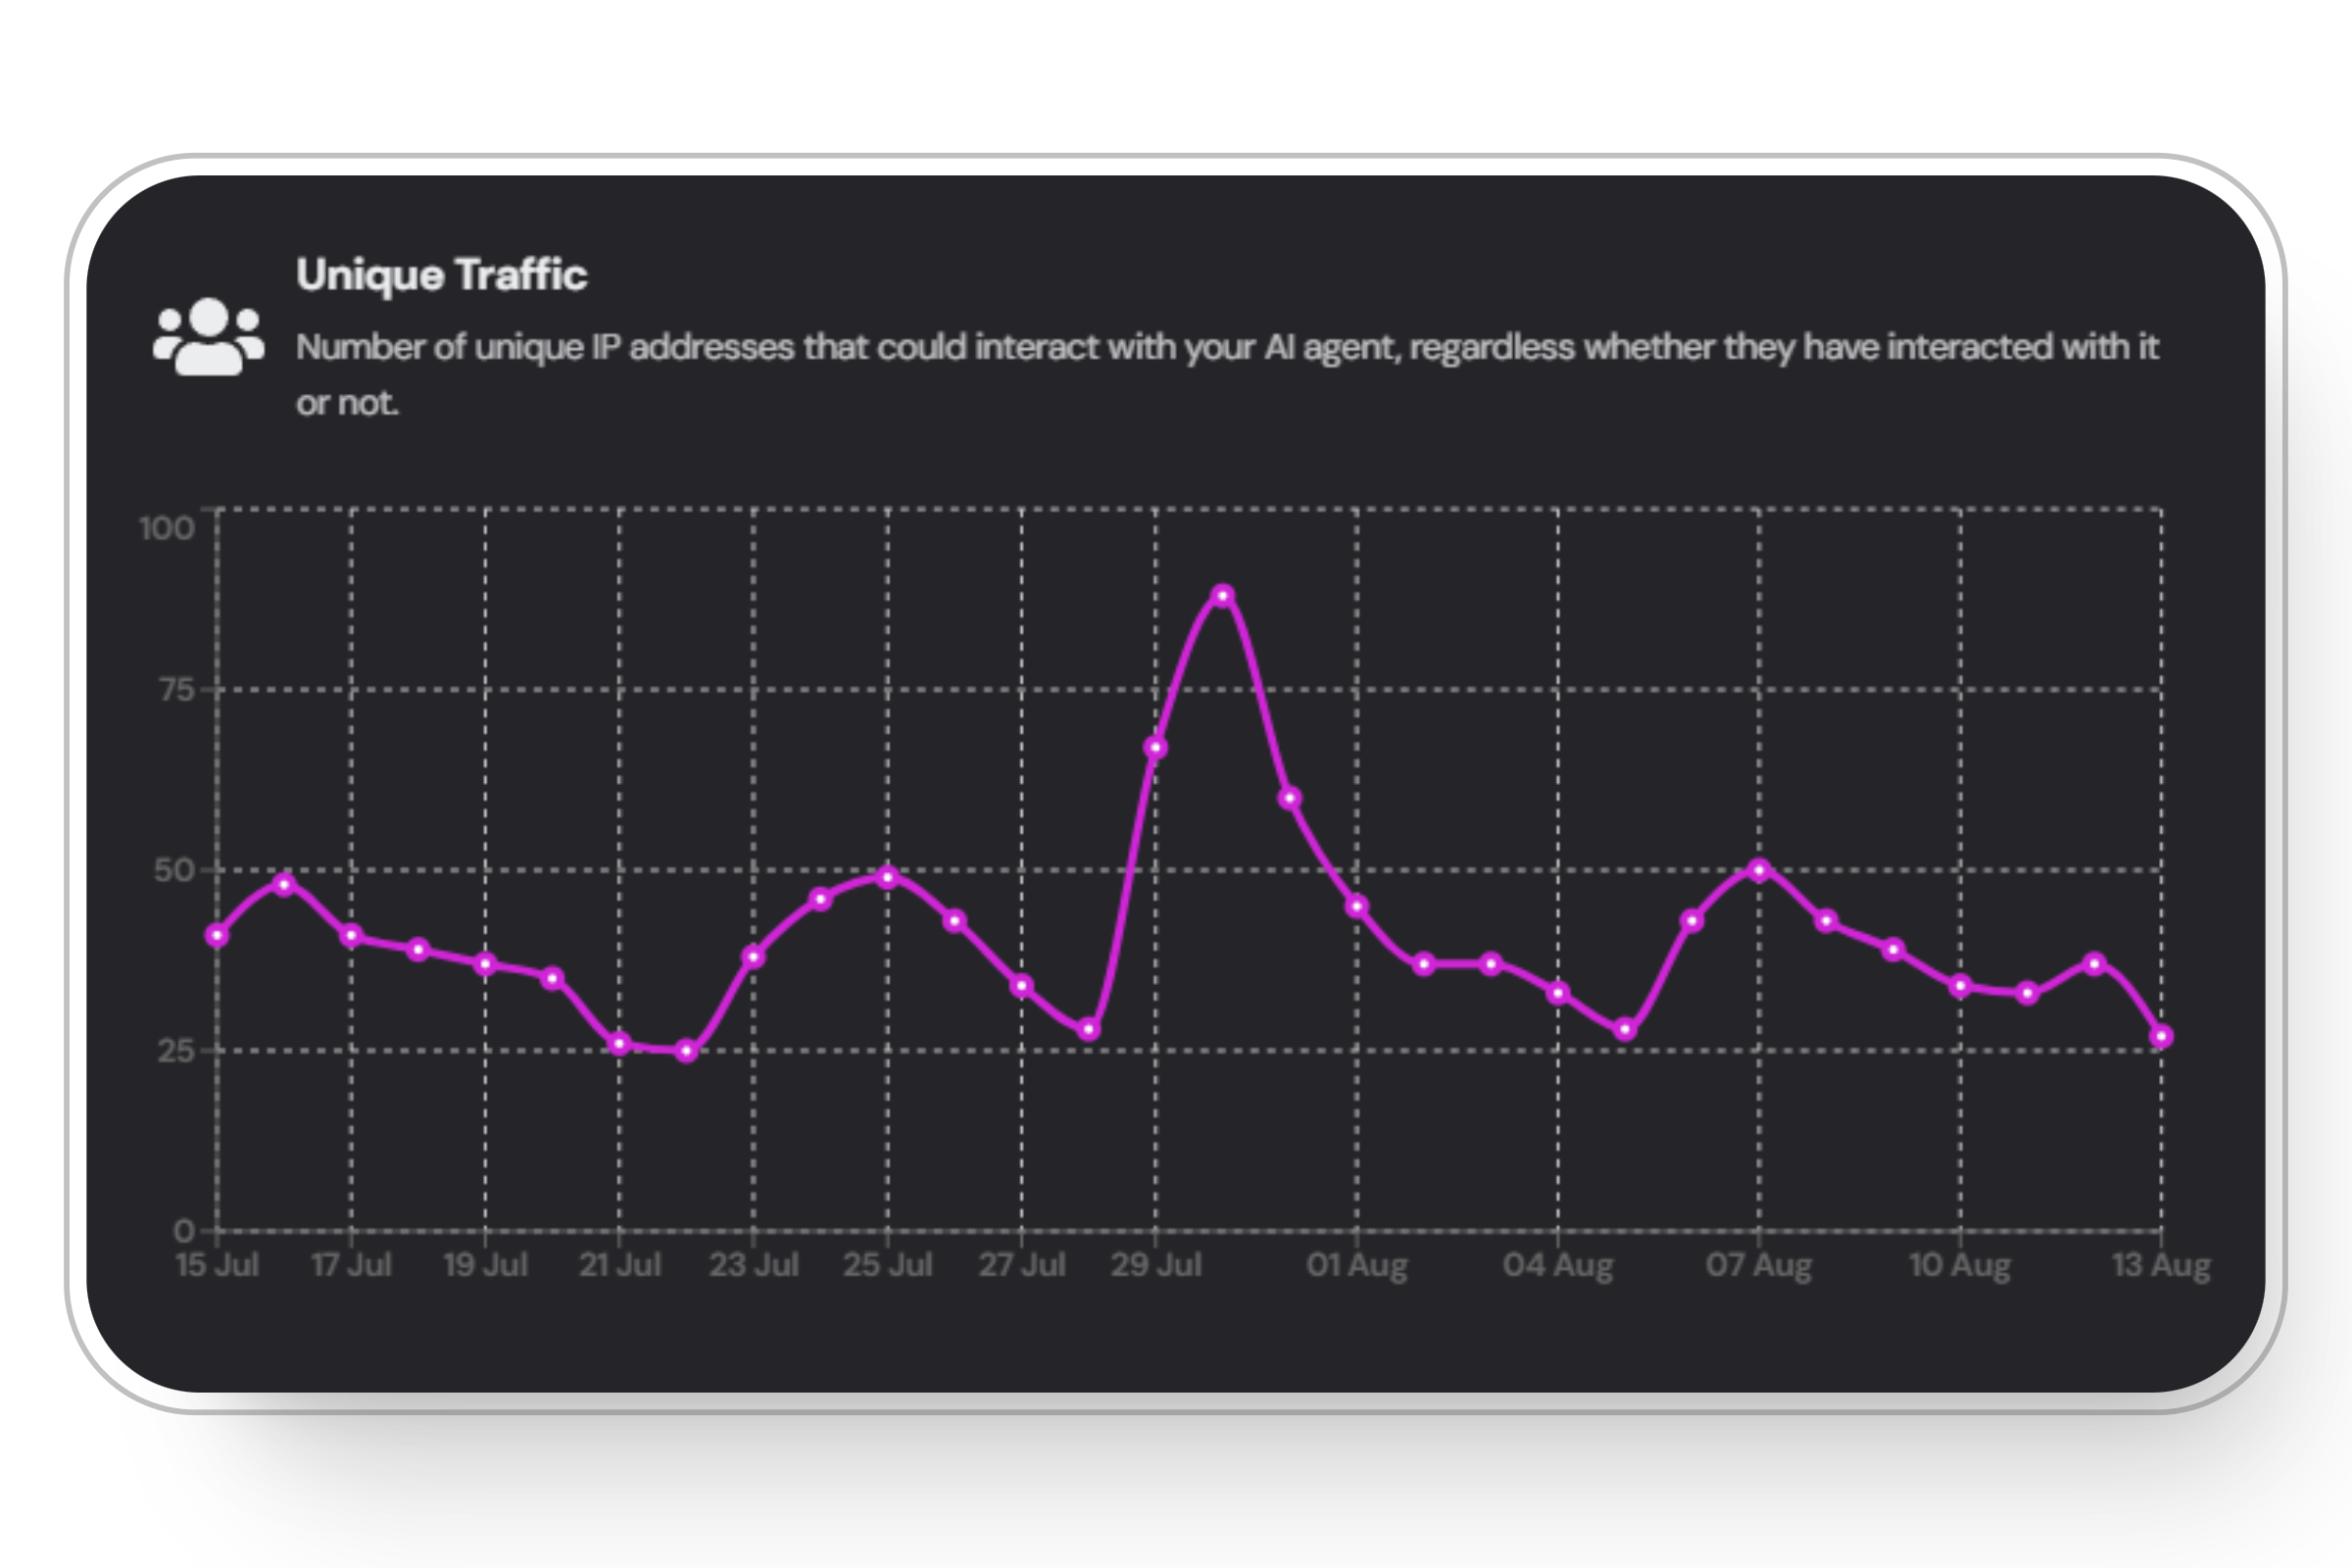
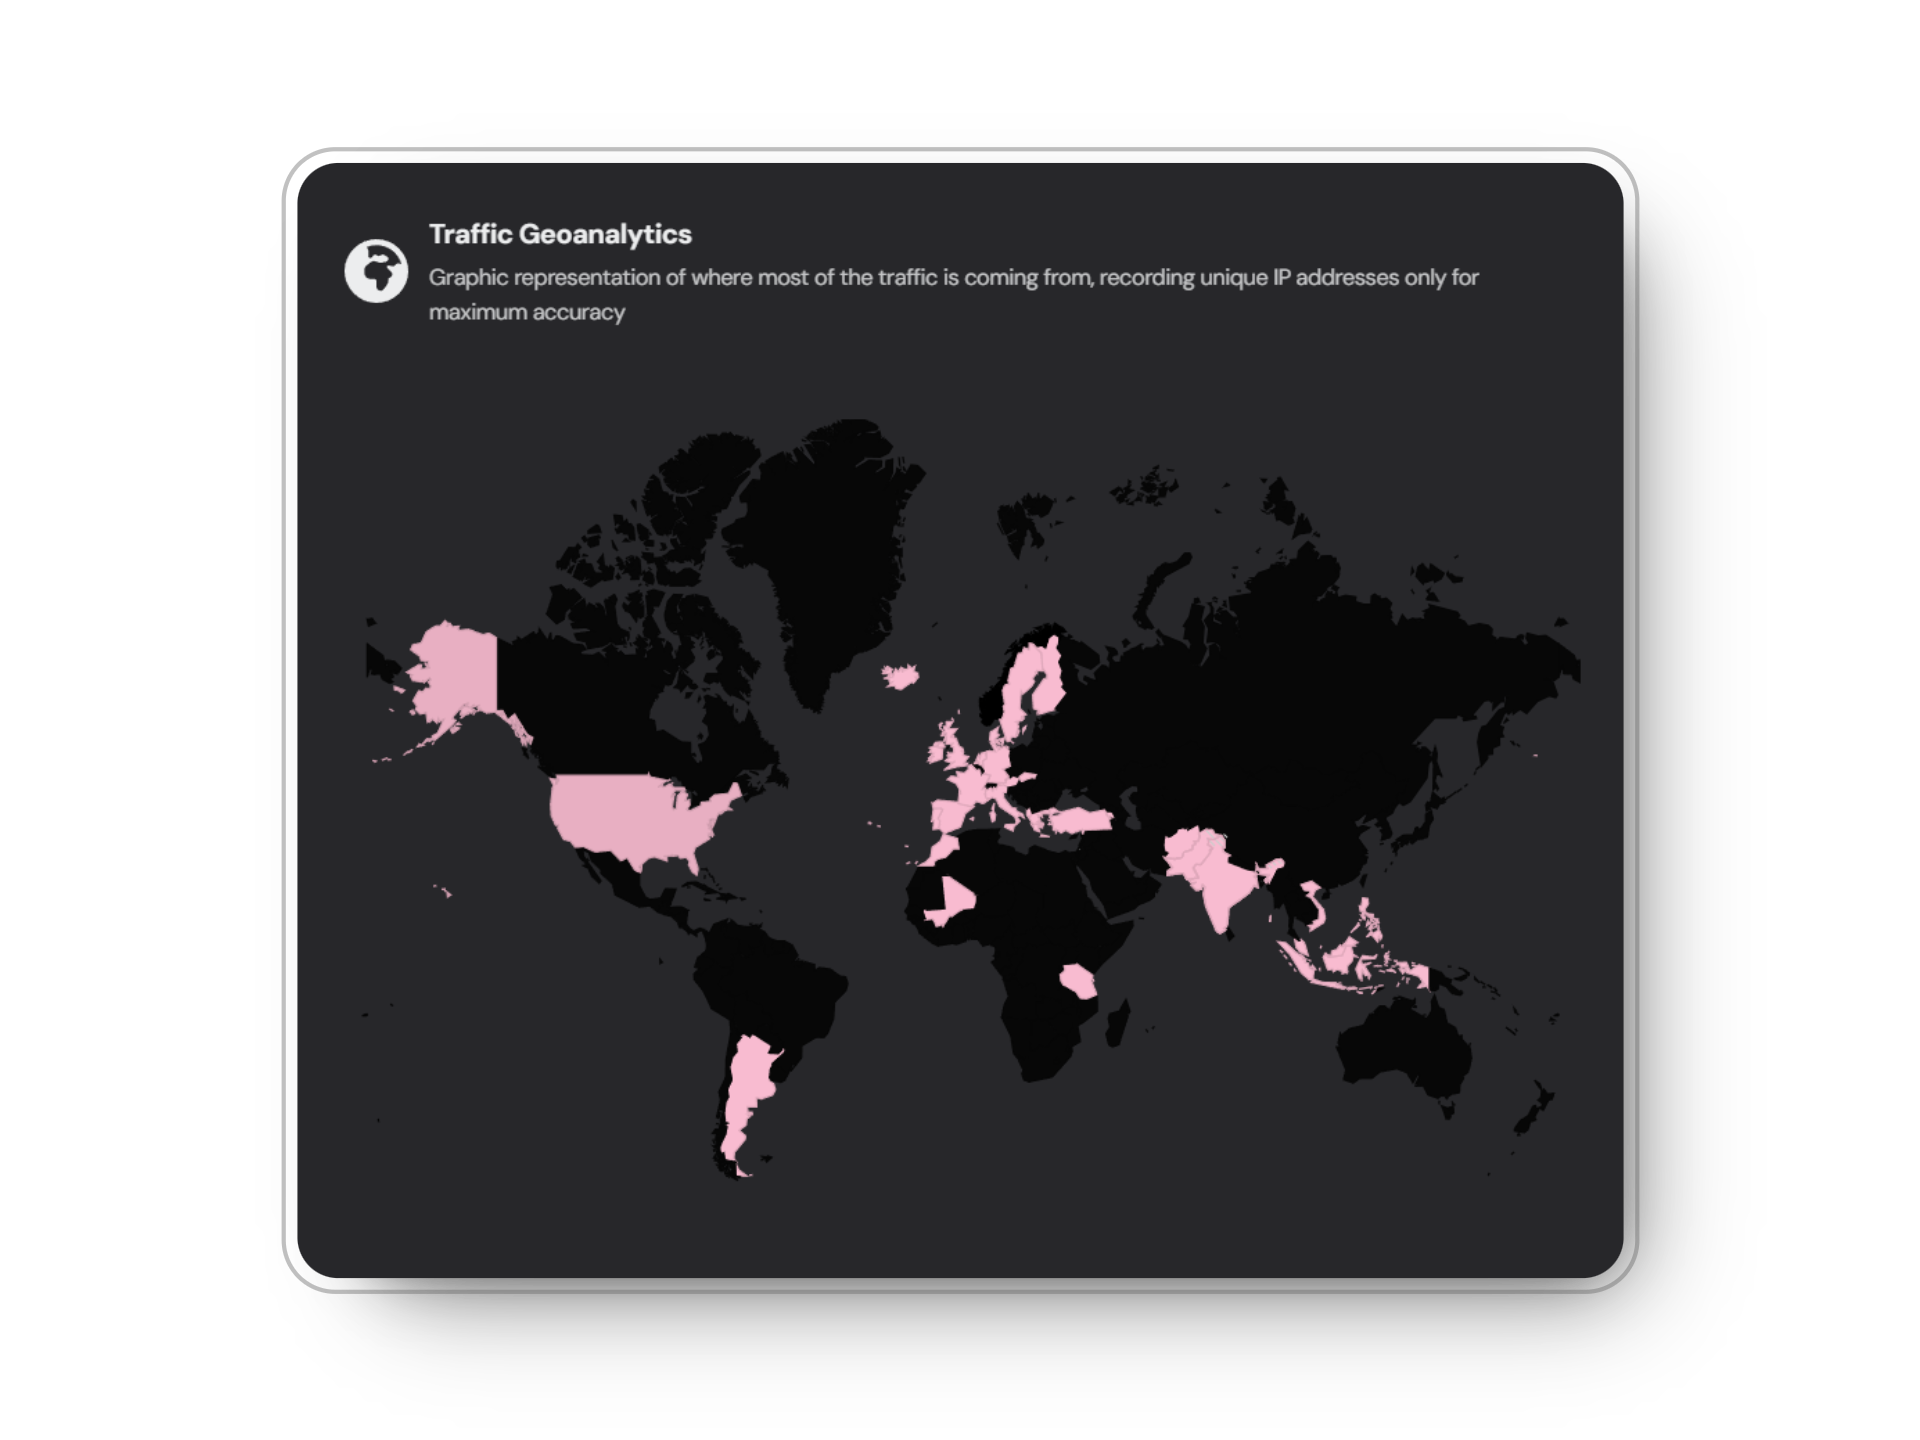 GeoAnalytics tracks unique website traffic, capturing all IPs that access your site. While it doesn't directly measure agent usage, it provides insights into the total number of visitors, with a percentage of these visitors likely engaging in conversations with your agent.
 Enabling **GeoAnalytics** incurs an additional credit cost of 0.1 per request on your website.
## Voiceflow-Specific Analytics
If you're using our Voiceflow integration, you'll have access to additional analytics specific to the platform:
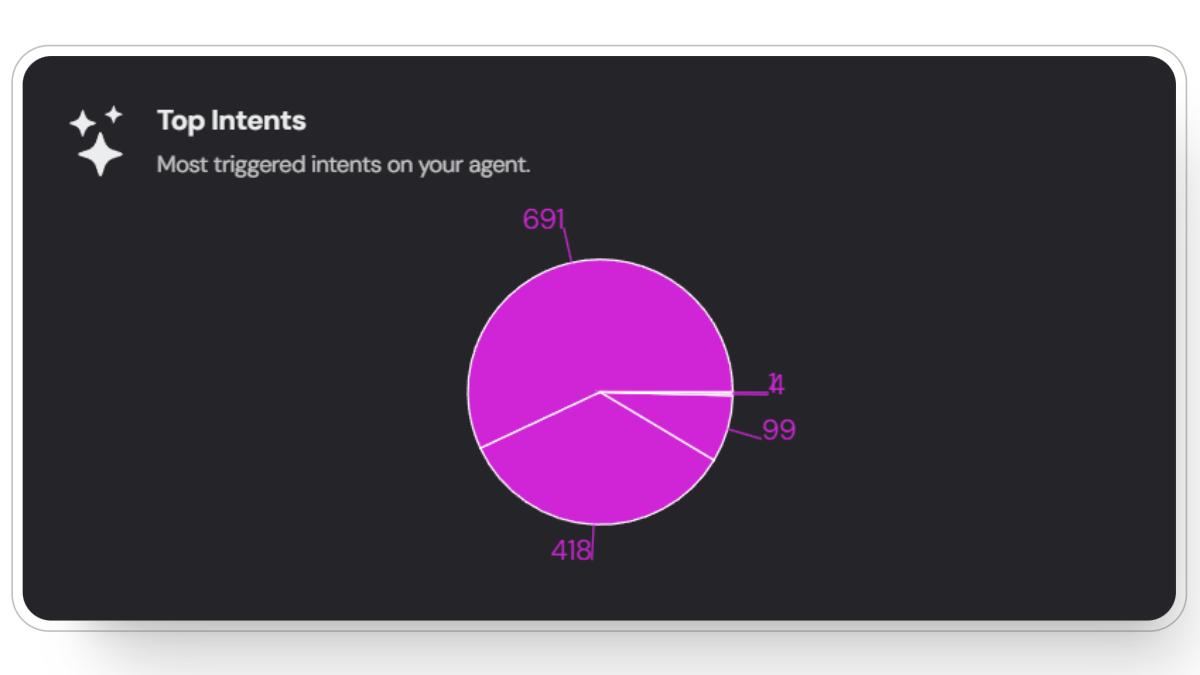
Visualize the most frequently triggered intents in a pie chart. Hover over the specific pie pieces to see the intent name.
Enabling **GeoAnalytics** incurs an additional credit cost of 0.1 per request on your website.
## Voiceflow-Specific Analytics
If you're using our Voiceflow integration, you'll have access to additional analytics specific to the platform:
Visualize the most frequently triggered intents in a pie chart. Hover over the specific pie pieces to see the intent name.
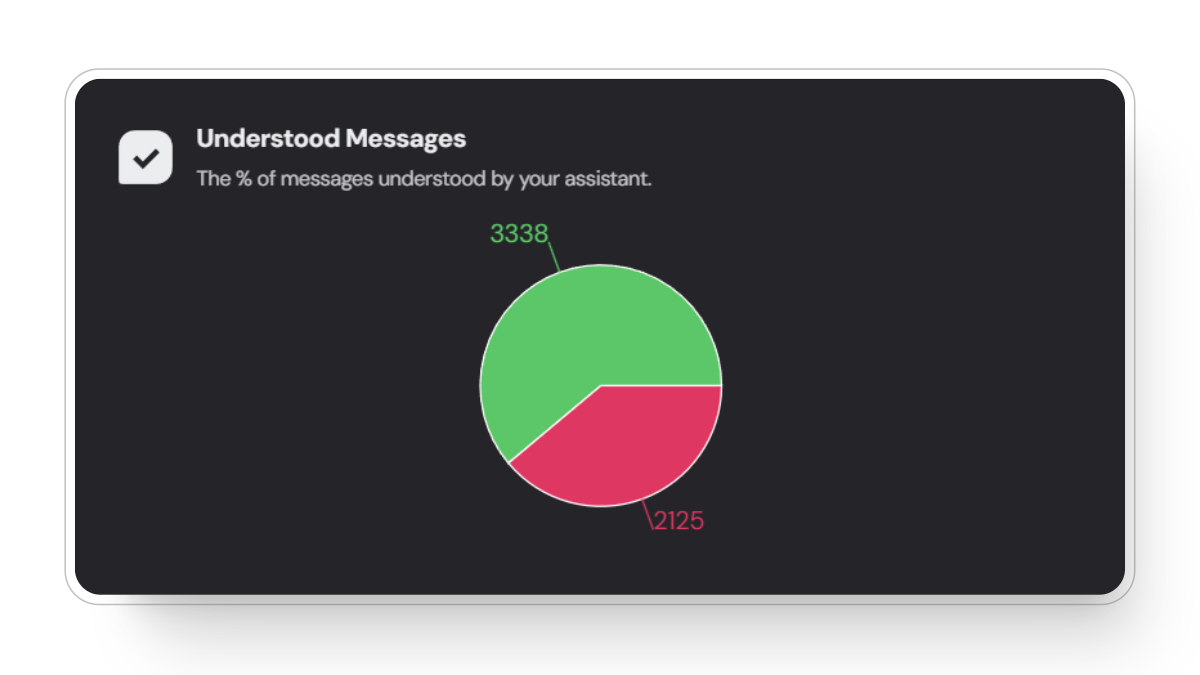
 See the percentage of messages successfully understood by your assistant. Green represents understood while red represents not understood messages by the voiceflow AI.
 ## Interpreting Your Analytics
Understanding your analytics is crucial for optimizing your AI agent's performance and enhancing user experience. By regularly reviewing these metrics, you can gain valuable insights into how users interact with your agent, identify areas for improvement, and make data-driven decisions to increase efficiency and engagement.
Regular analysis of your analytics can help you:
* Identify peak usage times
* Understand user behavior
* Optimize your agent's responses
### Tips to use the analytics efficiently:
Use the time range filter to view data for specific periods:
## Interpreting Your Analytics
Understanding your analytics is crucial for optimizing your AI agent's performance and enhancing user experience. By regularly reviewing these metrics, you can gain valuable insights into how users interact with your agent, identify areas for improvement, and make data-driven decisions to increase efficiency and engagement.
Regular analysis of your analytics can help you:
* Identify peak usage times
* Understand user behavior
* Optimize your agent's responses
### Tips to use the analytics efficiently:
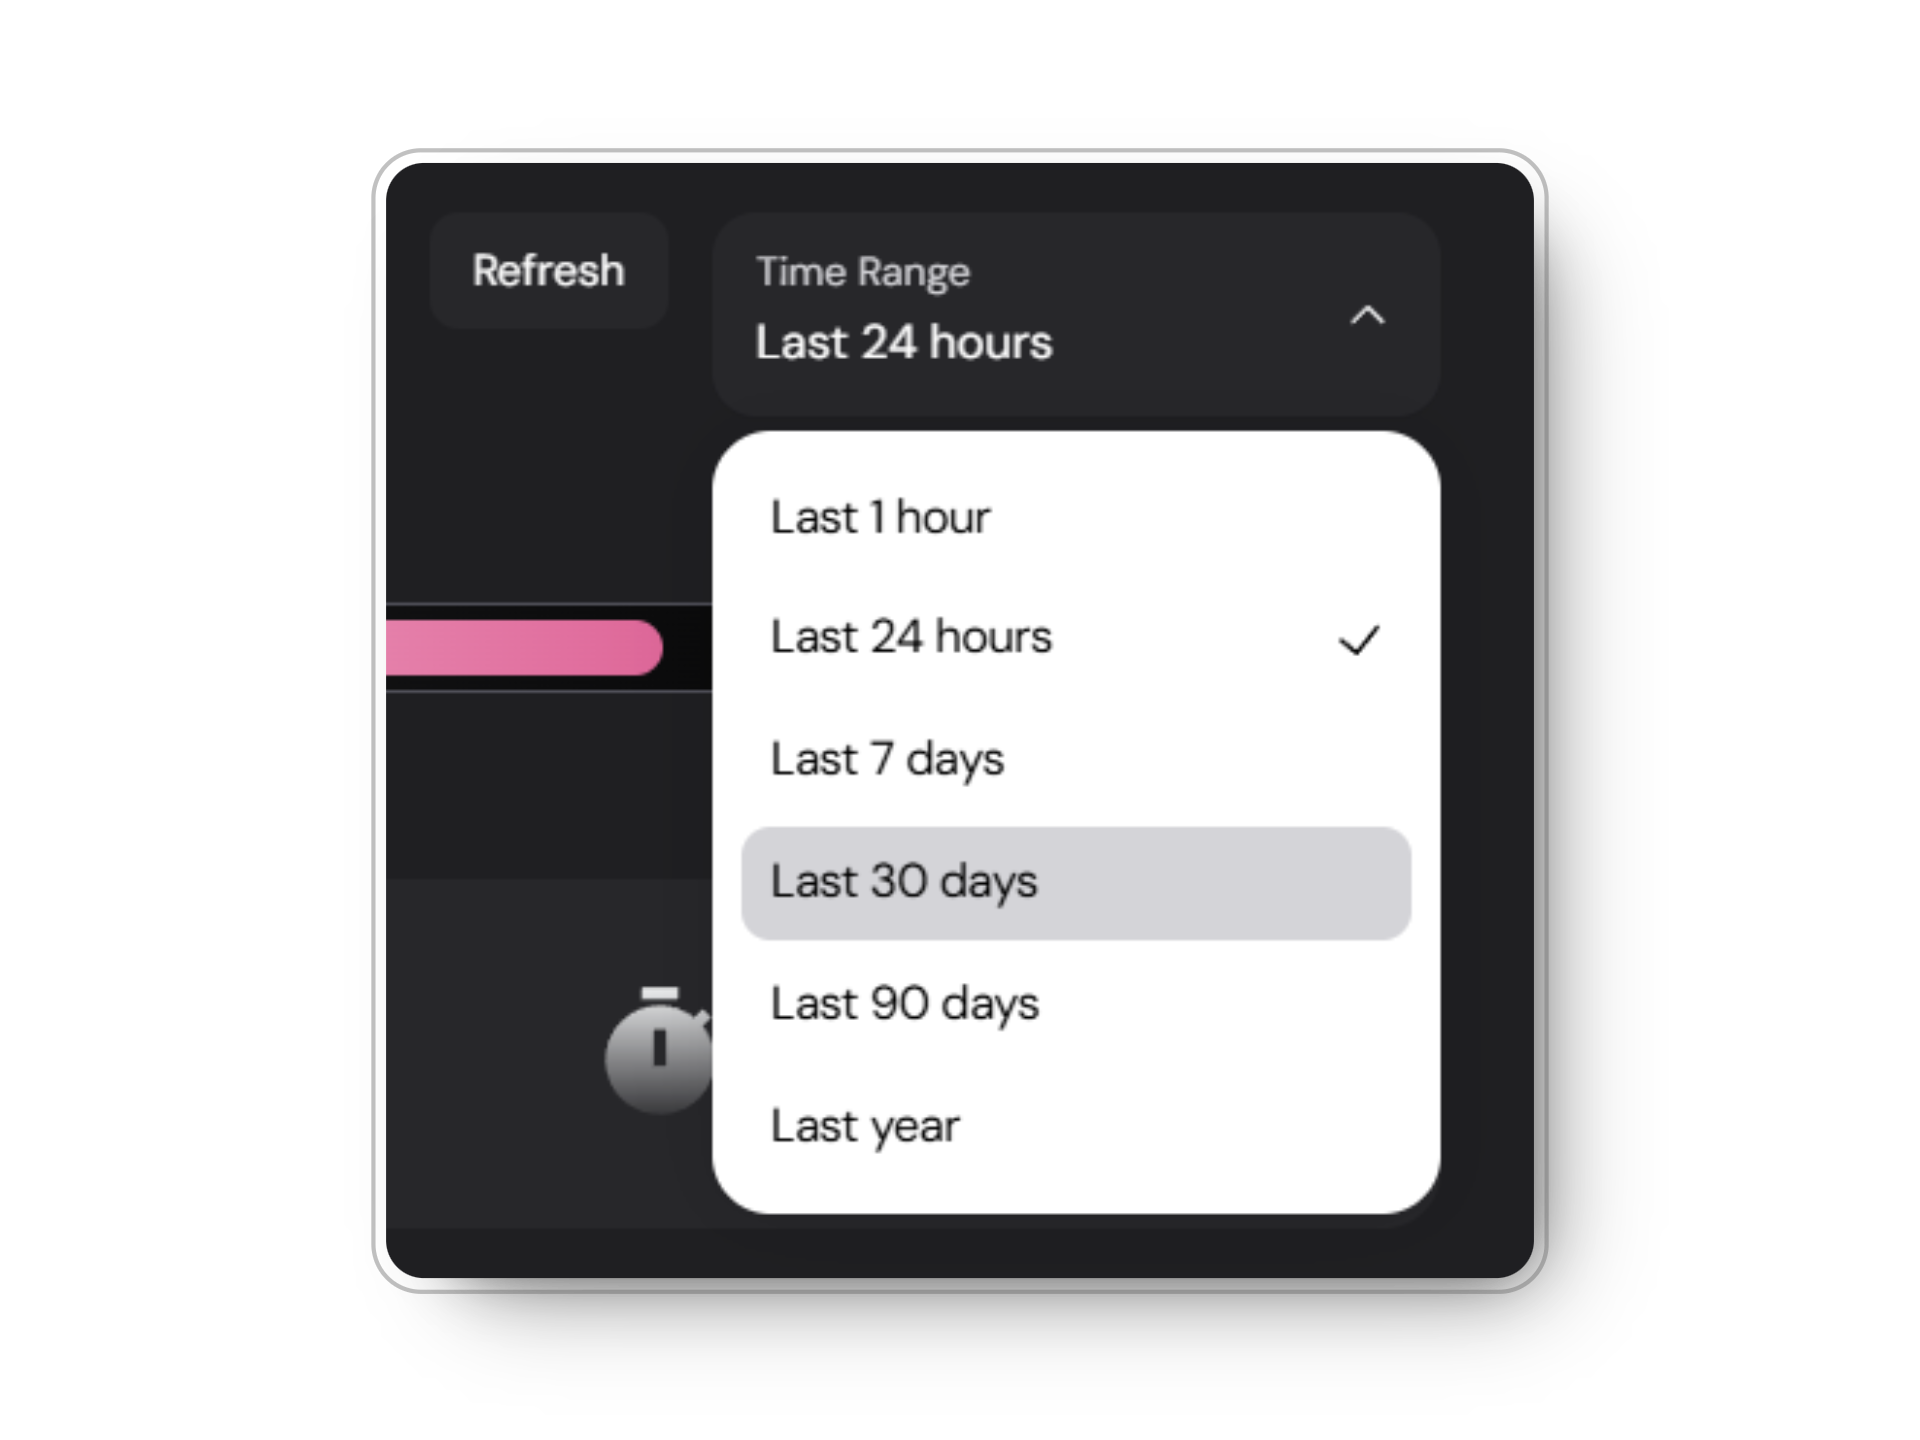
Use the time range filter to view data for specific periods:
 Analyze trends by comparing different metrics side by side. This allows you to identify correlations and patterns across various performance indicators.
Look for patterns in user interactions over time. This helps you understand peak usage times and general engagement patterns.
If average chat duration is high, consider ways to make your agent more efficient. This might involve refining responses or improving the knowledge base.
Analyze the user retention graph to see where users tend to drop off and improve those areas. This can help increase overall engagement and satisfaction.
When using voiceflow, utilize metrics like "Understood Messages" to refine your agent's comprehension. Focus on improving areas where the agent struggles to understand user inputs.
Analyze trends by comparing different metrics side by side. This allows you to identify correlations and patterns across various performance indicators.
Look for patterns in user interactions over time. This helps you understand peak usage times and general engagement patterns.
If average chat duration is high, consider ways to make your agent more efficient. This might involve refining responses or improving the knowledge base.
Analyze the user retention graph to see where users tend to drop off and improve those areas. This can help increase overall engagement and satisfaction.
When using voiceflow, utilize metrics like "Understood Messages" to refine your agent's comprehension. Focus on improving areas where the agent struggles to understand user inputs.